
Skip to content
Robotics & Automation
Machine data · Kuklabaz

What the machine is doing and how long it stops: a record, not a guess.

Kuklabaz collects state, counters and alarms from the machine's controller; downtime and availability show machine by machine, and the data flows into production tracking.

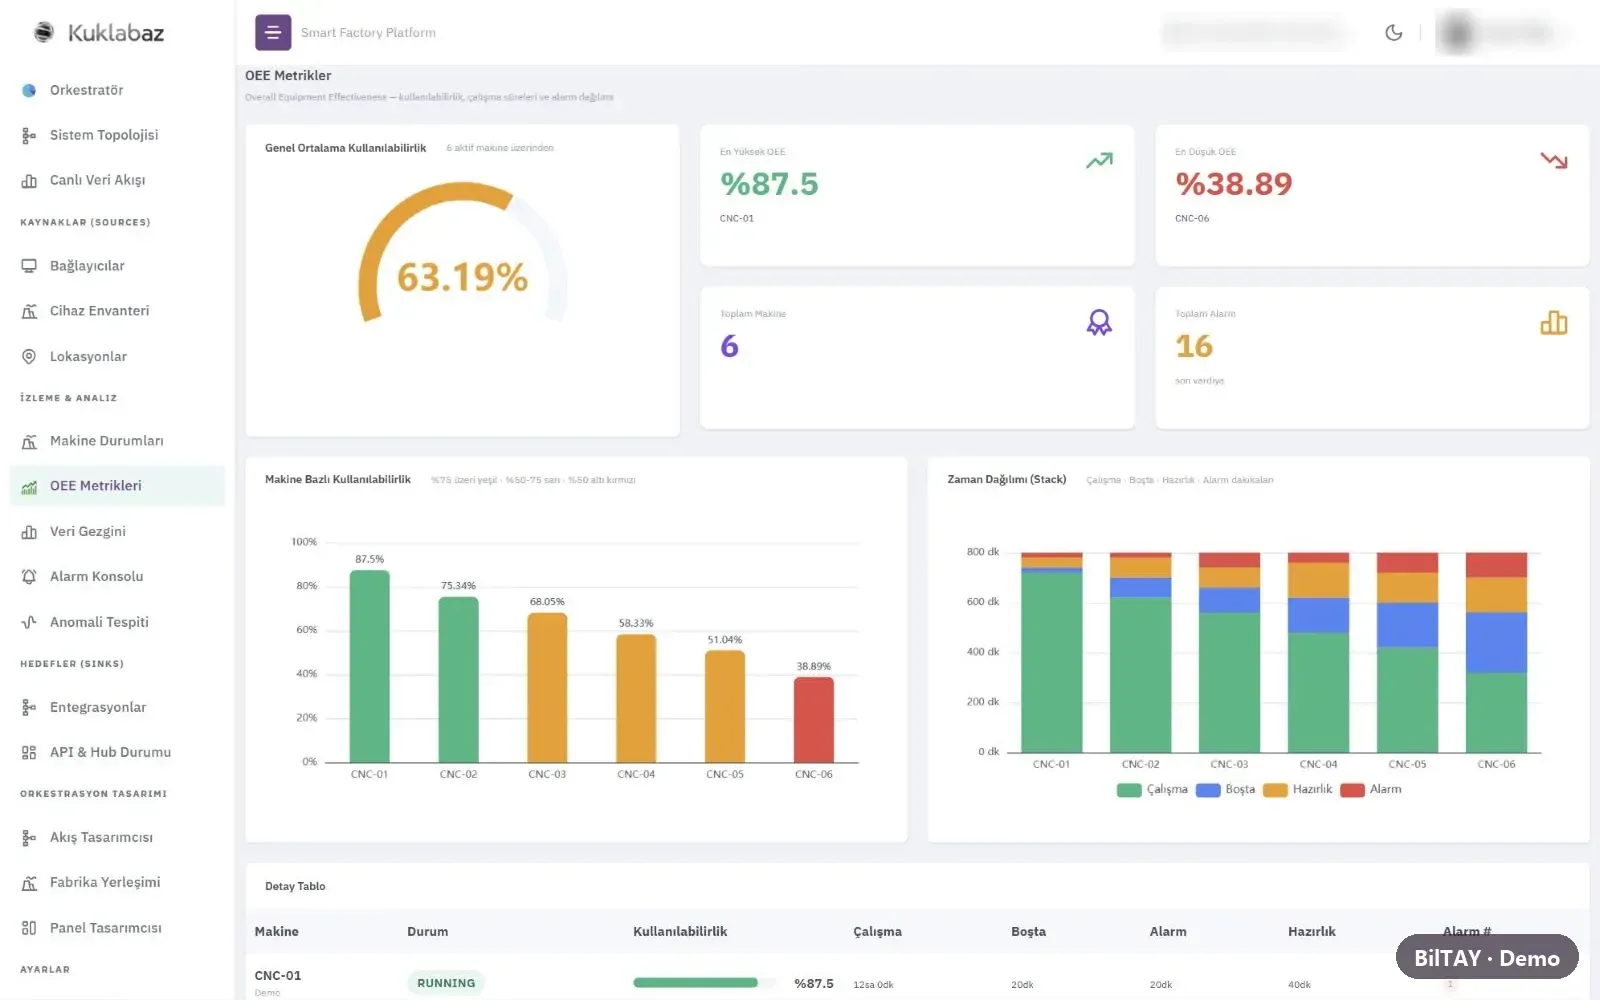
Kuklabaz OEE screen: per-machine availability with running, idle, setup and alarm time
01

State, duration, reason

Running, idle, setup and alarm time is collected for every machine, and availability is calculated machine by machine. When a threshold is crossed, an alarm rule raises a warning.

Downtime flows into ProCOST, BilTAY's production tracking software; efficiency is calculated in one place, so every screen shows the same number.
02

Which machines it connects to

We connect through the controller's own protocol; for older machines without an interface, a SkyBox data collection station is used.

Each new machine type is brought on line with measurements on site: the values read are verified first, then they go on the dashboard.

  • MTConnect
  • OPC UA
  • Modbus TCP
  • Fanuc FOCAS
  • Mitsubishi (MC protocol)
  • Heidenhain (LSV2)
  • SkyBox data collection station
03

Live state in the factory model

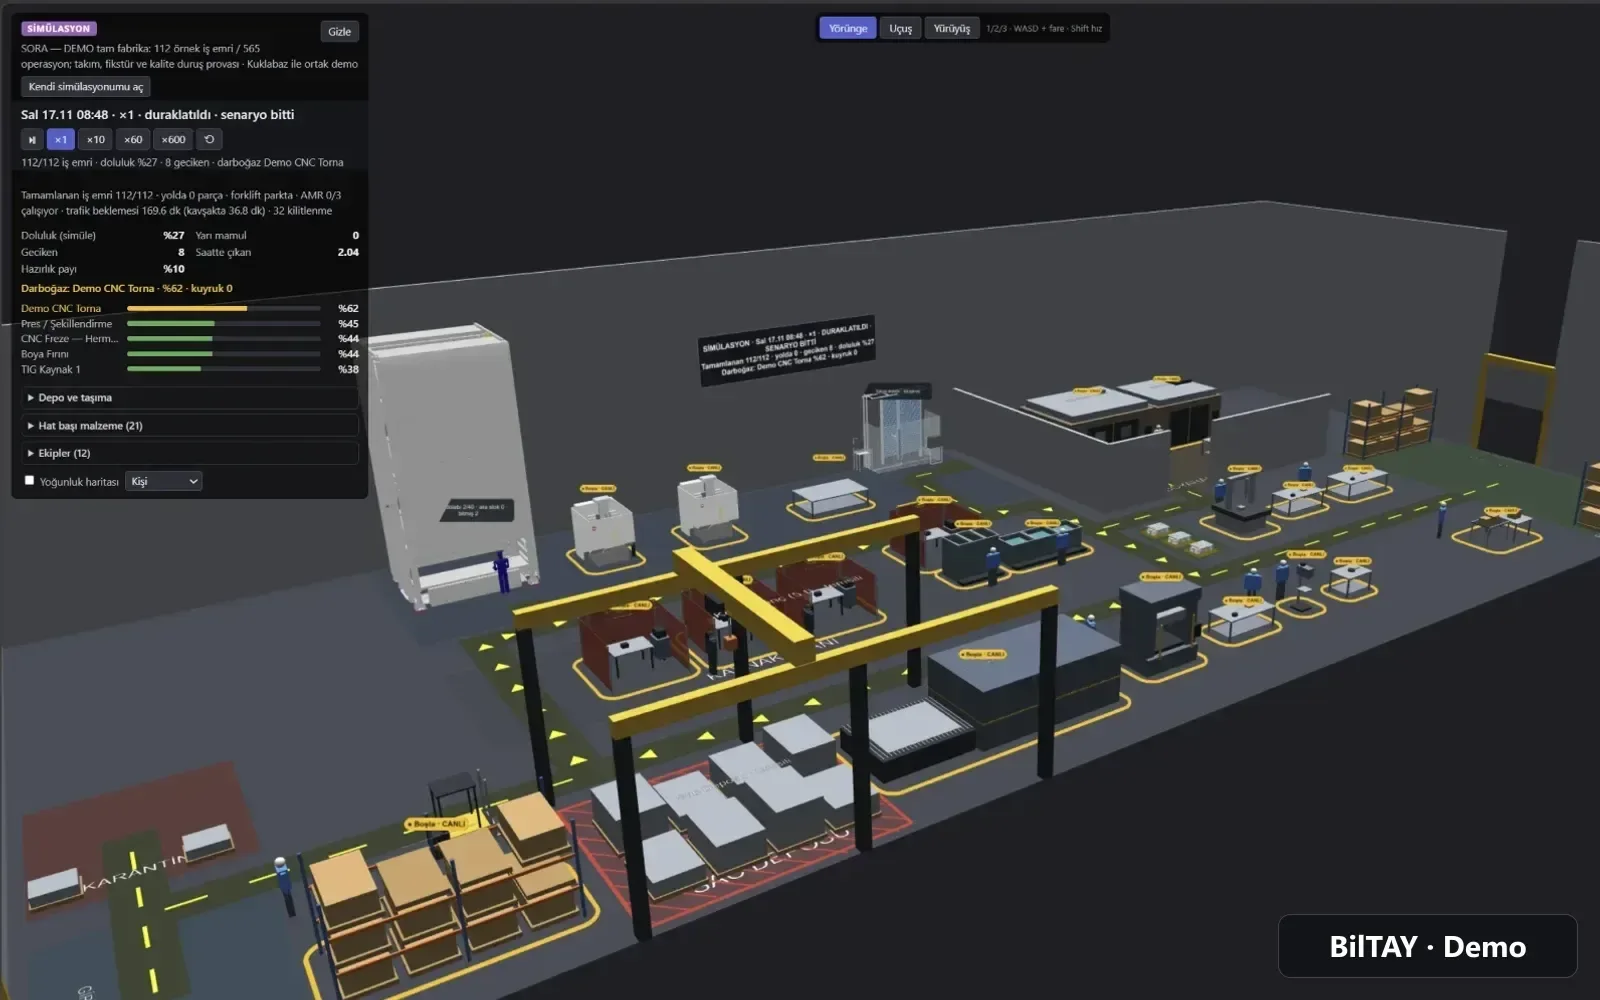
A machine connected to Kuklabaz shows its live state in the Sahne factory model; even while a simulation runs, real state and forecast don't mix. The workshop of our group company SORA is monitored this way.

Line simulation
Sahne factory model: live state labels above the machines, simulation panel on the left
Contact

Let's talk about this

Tell us about your line and your goal; we'll measure on site and get back to you.